CASE STUDY
Improving visibility into drug-related financial performance
OVERVIEW
Led end-to-end UX design as the sole UX designer, working closely with product, engineering, and content to deliver a feature that enables Trisus Financial Management users to track and visualise the financial impact of drug reimbursements, purchases, and margins over time—improving operational oversight, rebilling accuracy, and auditing.
PROBLEM
Users lacked a structured, in-app way to track financial impact over time. They relied on manual workarounds such as spreadsheets which are inefficient, prone to human error and not connected to the system’s data. Without the ability to monitor and measure financial impact, and to visualise trends and changes, hospitals struggled to demonstrate value, identify opportunities, and take informed action.
USER GOALS
BUSINESS GOALS
Understand how drug-related financial impact changes over time.
Quickly identify areas where margins are improving or declining.
Track all financial items in one place, reducing the time spent updating spreadsheets.
Share clearer, data-driven insights with colleagues without recreating reports from scratch.
Reduce the amount of time users spend on manual financial tracking.
Increase adoption of the Trisus Financial Management platform.
Provide clearer value metrics to strengthen customer retention.
Support revenue integrity through more reliable financial visibility.
USER STORY: FINANCIAL ANALYST
“As a financial analyst, I want to track the financial impact of drug reimbursements, purchases, and margins in Trisus so that I can quickly understand trends, reduce time spent on spreadsheets, and make data-driven decisions for my facility”.

Discovery and definition
Conducted stakeholder interviews to understand business requirements and identify pain points in the existing process.
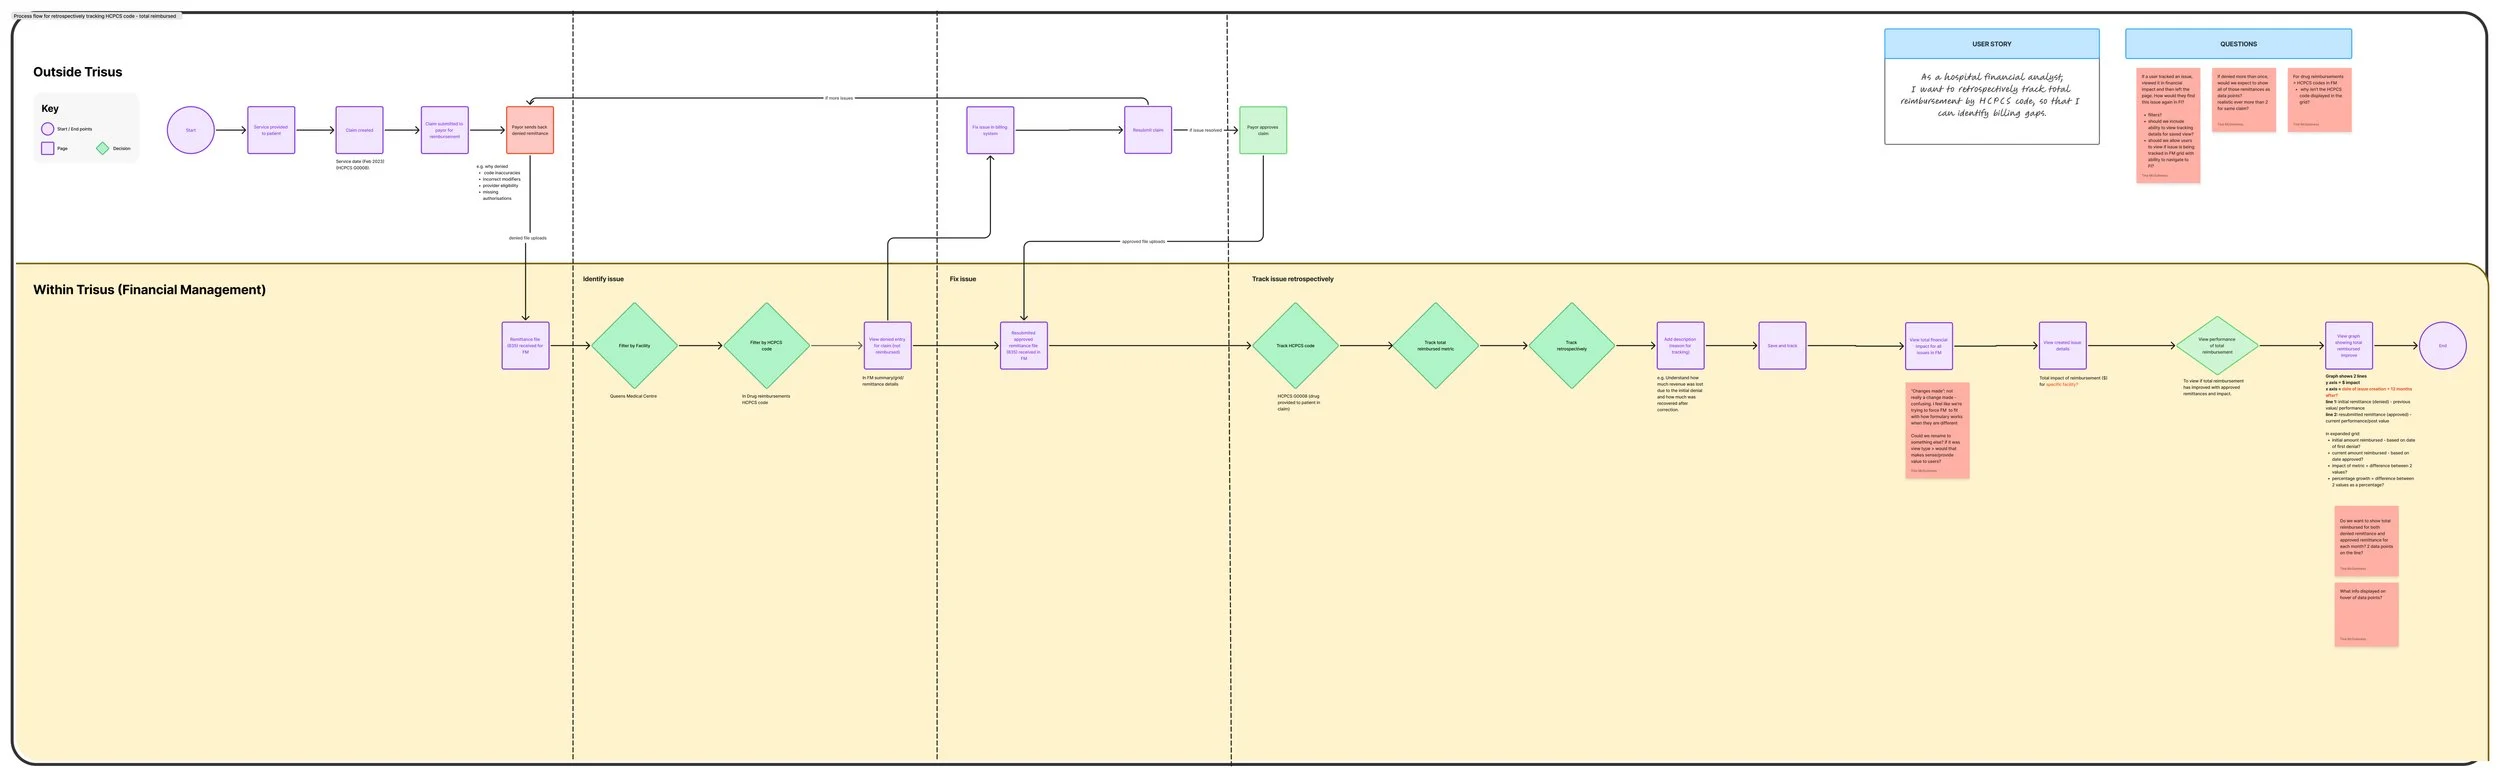
Mapped the end-to-end journey from service to patient to claim submission, both within the Trisus platform and across external systems, to understand how the process worked holistically.
End to end process flow
Created user flows for different types of analysis, including retrospective and forward-looking use cases.
Identified and documented all relevant records and metrics that could be tracked, such as drug reimbursements, purchases, and margins, to inform reporting and analysis needs.
User flows
Challenges and constraints
The project came with several challenges that shaped the design process;
Margins were not feasible to track individually, so the experience had to rely on automatically tracking margin metrics tied to selected reimbursement or purchase metrics.
The features requirements were continuously evolving, which meant the interface needed to stay flexible while different teams aligned on a single approach.
Due to the scope of the project being large, we delivered the product incrementally, focusing on an MVP that provided immediate value while still exploring options for the future vision.
Designs went through multiple iterations, and I had to continuously adapt flows, simplify interactions, and ensure users still had a clear and understandable way to navigate complex information.
Managing tracked records
Research and key iterations
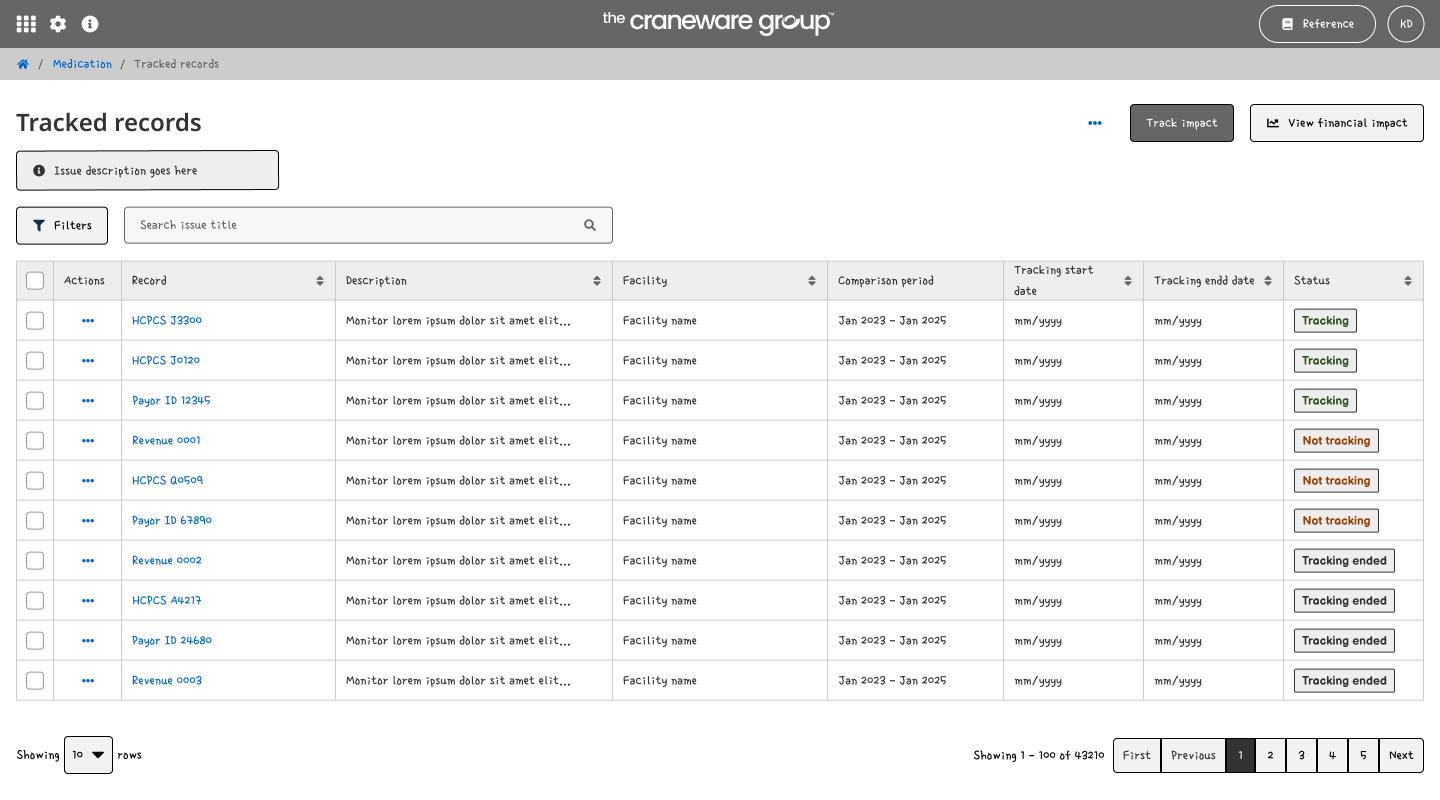
The first iteration explored a new Manage Tracked Records page. This page allowed users to view and manage all tracked records in a single table, drill down into individual records to view detailed tracking data and graphs, and start tracking new records directly from this page.
Manage tracked records
Insights
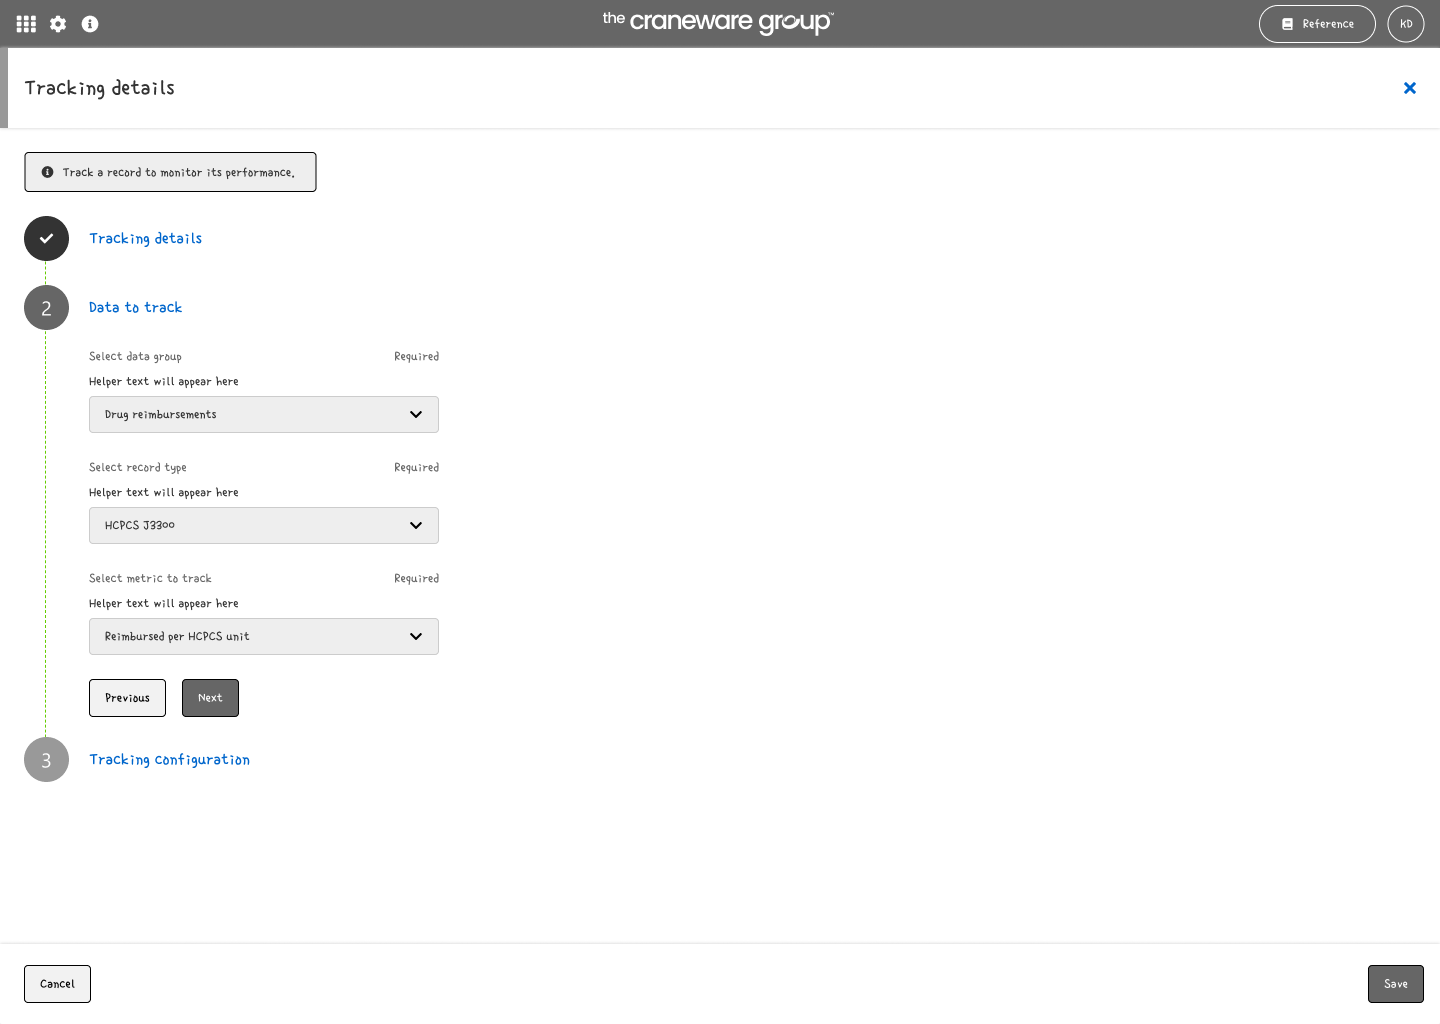
Tracking setup
1. Details: Title & description
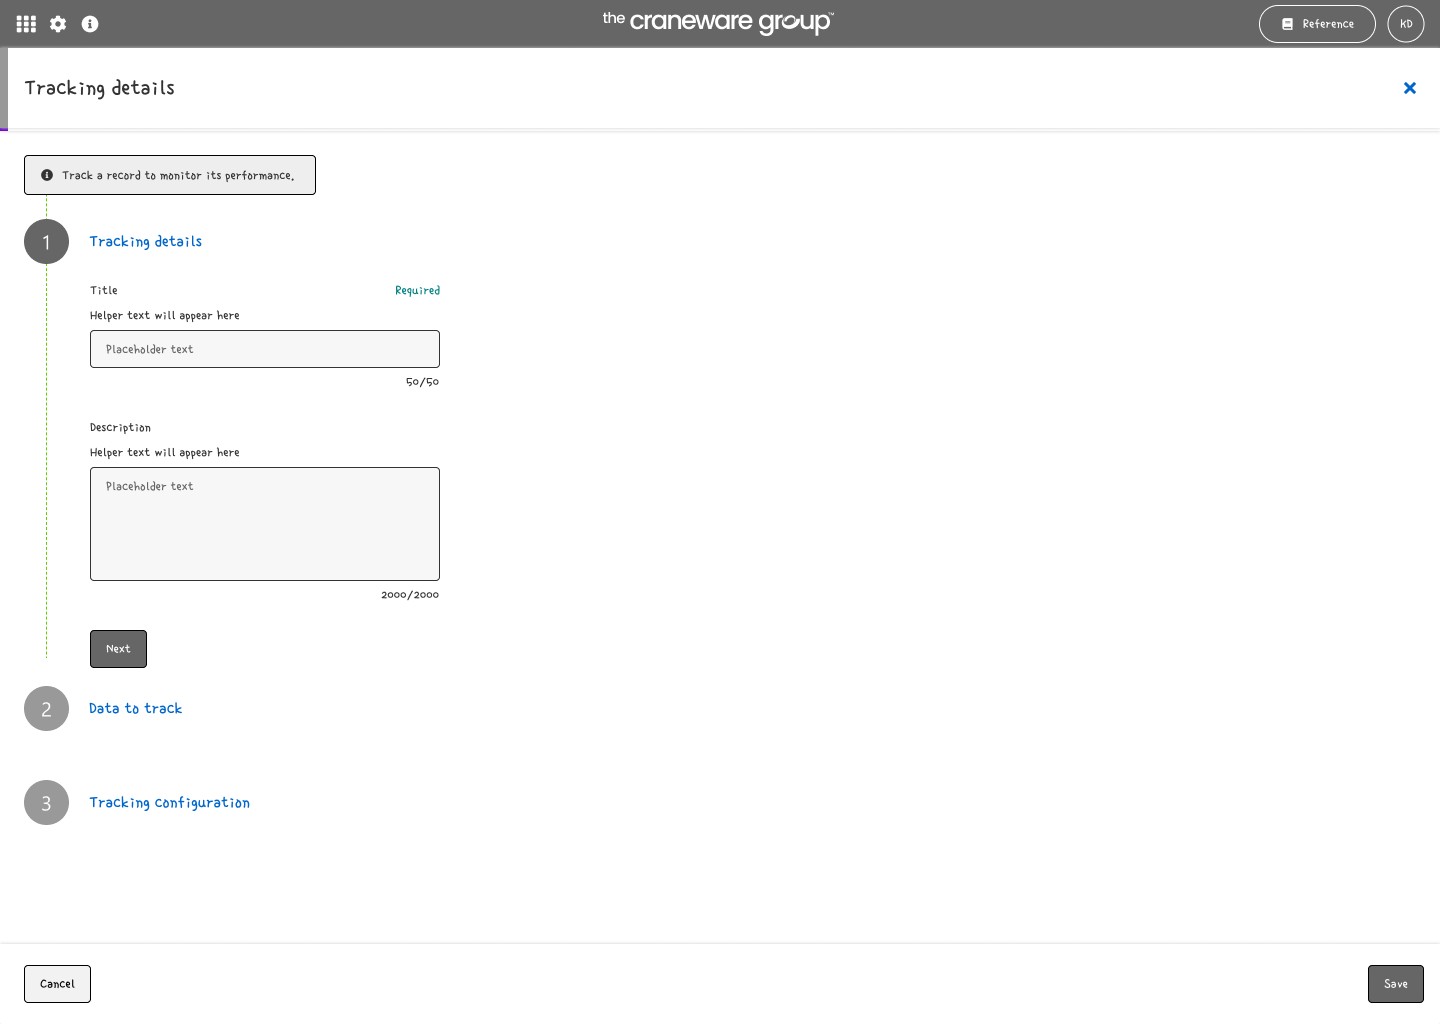
To track a new record, I initially designed a stepper-based setup flow, navigable from the record management page. The process required multiple steps, including;
Adding a title and description
Selecting drug or reimbursement,
Choosing a record type,
Defining a metric,
Selecting an analysis type, and,
Setting timeframes. T
The stepper was intended to guide users through this complex workflow in a structured way, reducing cognitive load by breaking the setup into manageable stages, using an existing design pattern.
2. Data: Group, metrics and record
This approach introduced unnecessary complexity and required more development effort, particularly due to the introduction of a completely new page.
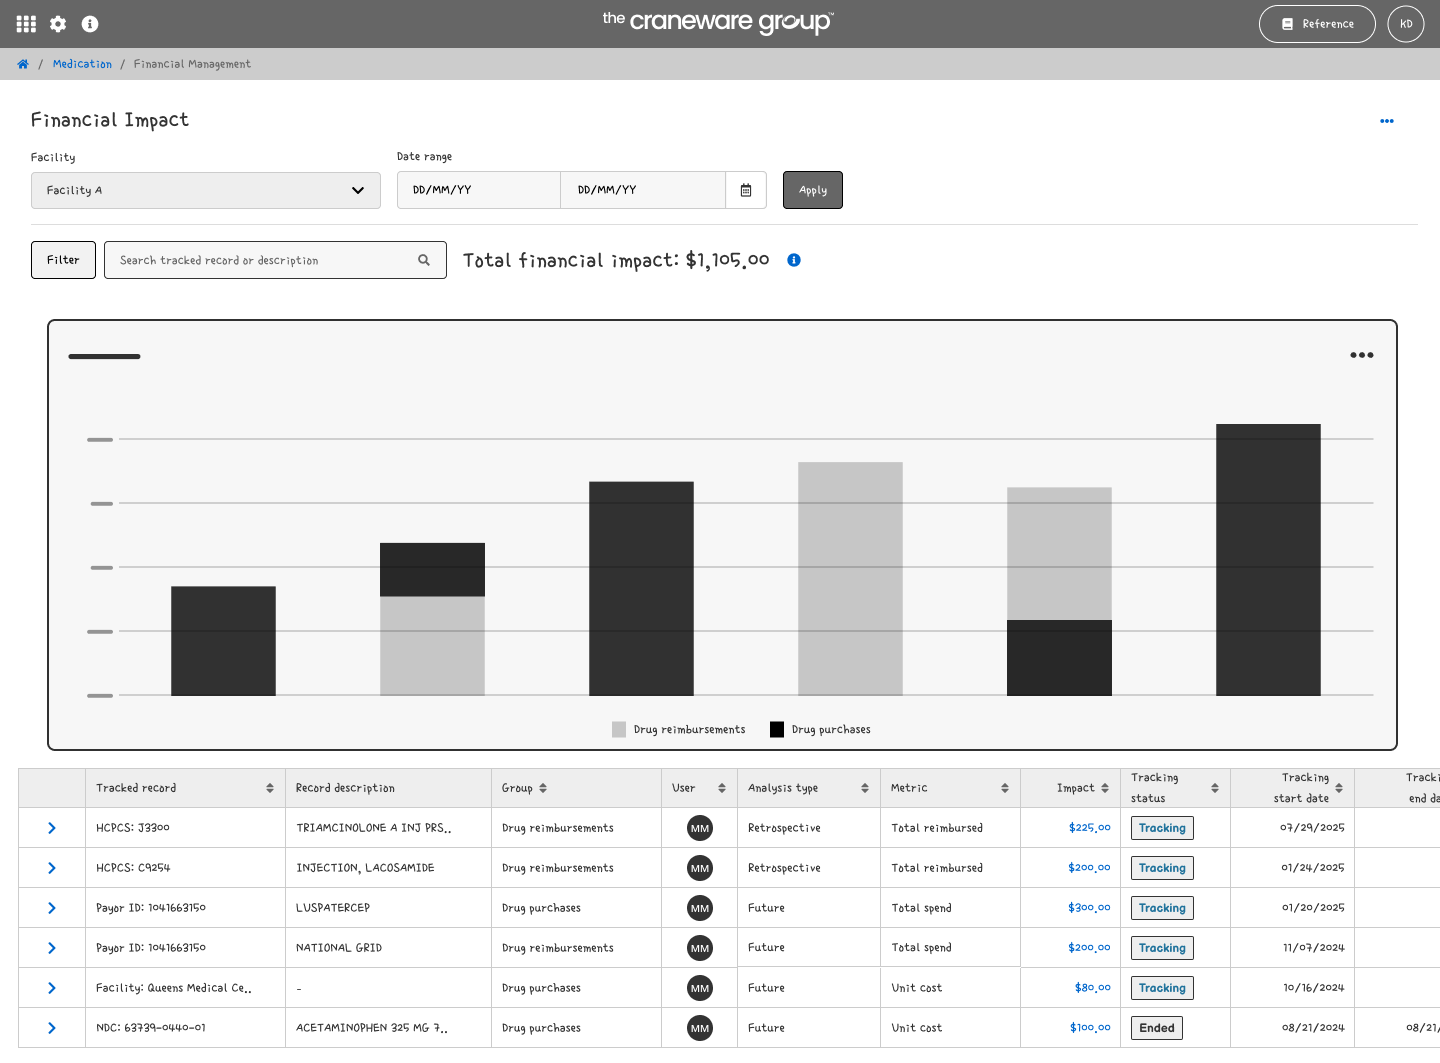
Used Financial Impact page to show tracked records and total impact
View record details
Decisions
We removed the separate record management page and surfaced tracked records on the Financial Impact page, which shows users the total financial impact of all tracked items. This was an already existing feature for similar products on Trisus. This decision reduced development effort, and allowed users to quickly drill down into individual records to view detailed tracking and performance graphs.
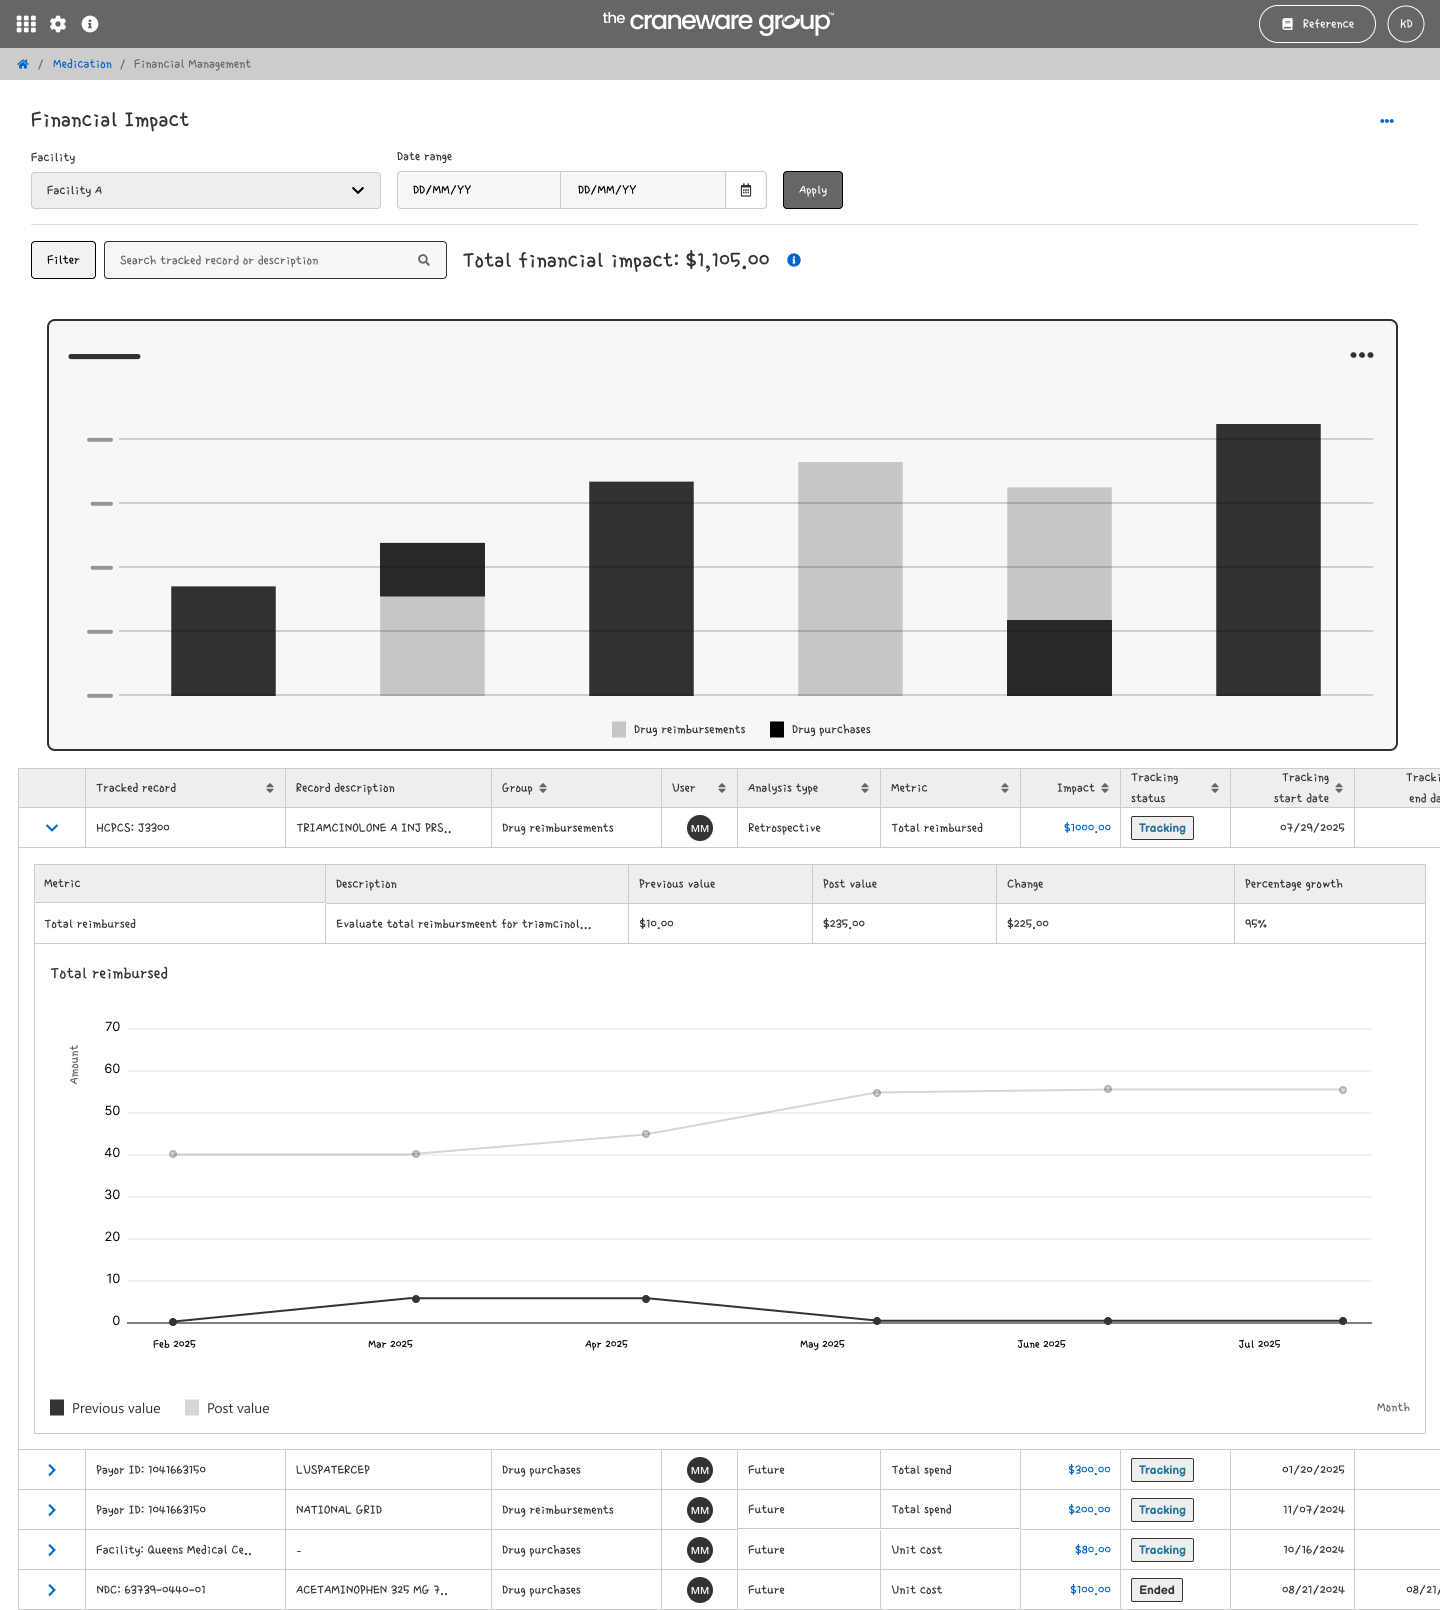
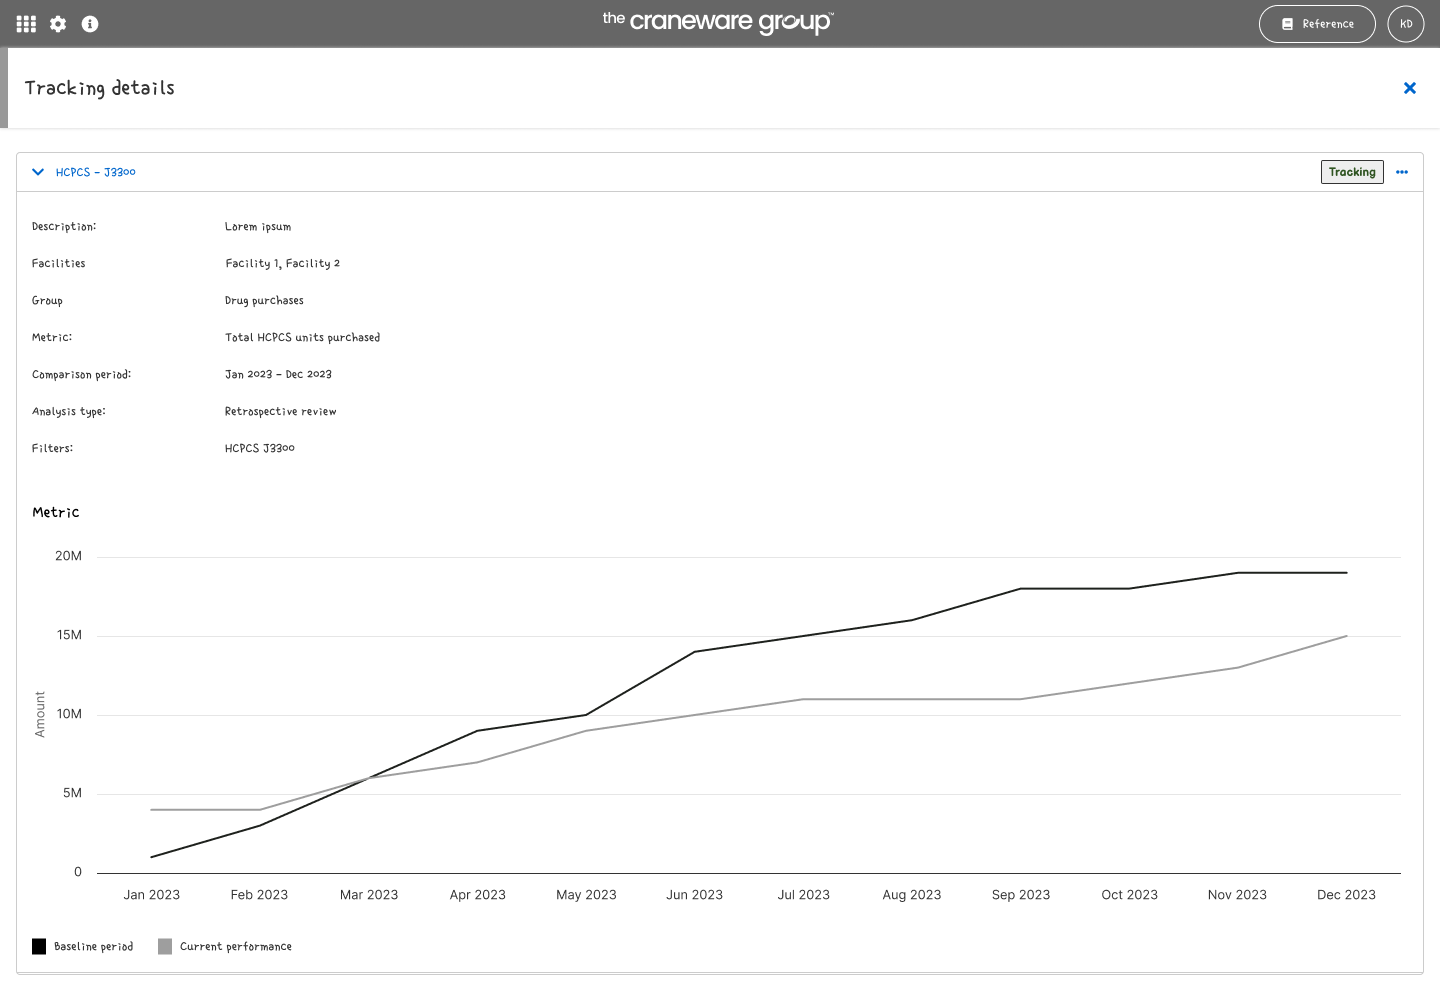
Drill down on metric performance
Insights
Once the decision was made to remove the record management page, it became clear that much of the setup information could be inferred from context on the Financial Management summary page. Pre-selecting filters and applying existing context significantly reduced the number of inputs users needed to provide.
Decisions
3. Configure: Facility, timeframe, analysis
The stepper was removed, and the setup flow was simplified to just three inputs:
Metric,
Analysis type, and,
Description.
This reduced cognitive load, minimized manual effort for users, and leveraged existing context to streamline the workflow.
Key deliverables
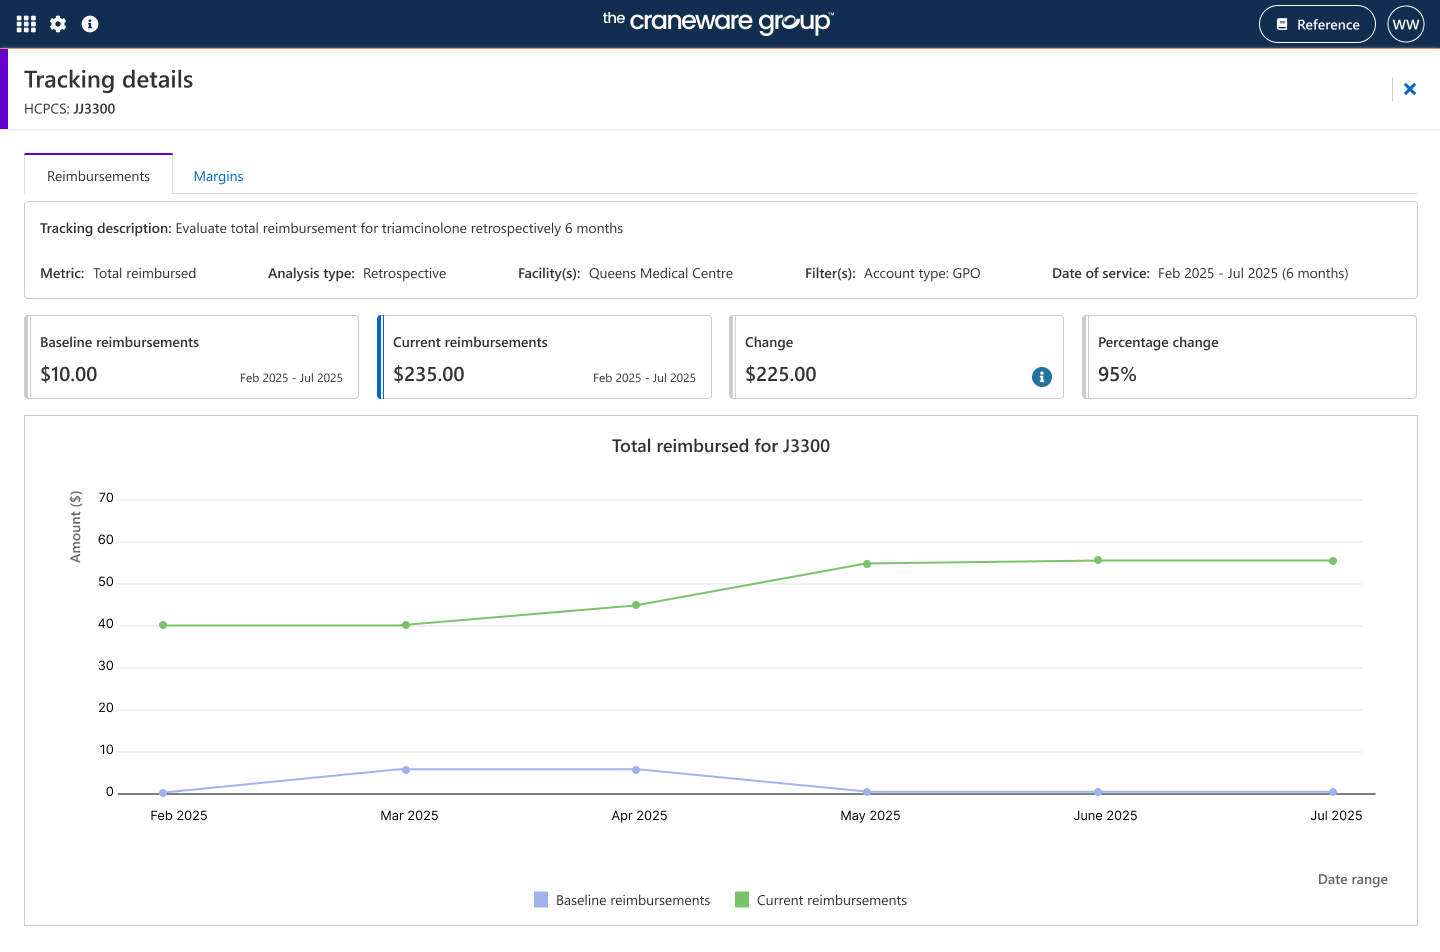
Track records: Monitor drug reimbursements or purchases by HCPCS codes, NDCs, facilities, payors, and other identifiers.
Select metrics: Choose metrics to track such as total reimbursed, total spend, or margin for each record.
Retrospective analysis: Compare baseline and current reimbursements to support rebilling and auditing.
Forward-looking analysis: Monitor trends by comparing historical data with current periods, with live updates for ongoing operational oversight.
Final prototype
Multi-facility support: Track financial impact across one or more facilities with visibility into each.
Financial impact calculation: Calculate impact in dollars ($) and percentage (%).
Graphical trend visualizations: Visualize trends over time to identify improvements or declines.
Search & filter: Quickly locate records or metrics by user, status, facility, or identifier.